Chicago Crime Rate Prediction
I built a linear regression model (ElasticNet) to predict Chicago’s daily crime rate by web scraping 10 years worth of various weather data. Then I added more data (total ridership and unemployment rate) on top of performing feature engineering.
Project Intro/Objective
The City of Chicago spends more than $4 million dollars on the Chicago Police Department DAILY, which is 38% of their budget. Accurate,or any, prediction on daily crime rate can assist the City of Chicago with better budgeting for efficient use of resources.
Methods Used
- Linear Regression (ElasticNet)
- Web Scraping
- Data Preprocessing
- Feature Engineering
- Data Visualization
- etc.
Notable Technologies Used
- Python 3, Jupyter Notebook
- Pandas, Numpy, Matplotlib, Seaborn
- Selenium, BeautifulSoup
- Scikit-learn
- RandomizedSearchCV
- etc.
Feature Engineering
Project initially started with only using weather data (temperature, humidity, pressure, wind condition, and weather conditions) because I had a hypothesis that weather is highly correlated to crime rate in general. Then, poor model performance guided me to add more features (total rides per day and unemployment rates). My most time was spent on taking an iterative approach to feature engineering.
- Temperature & Its Moving Avg- high/low of the day. Hotter it is, people are more hot-tempered
- Humidity - How uncomfortable are you?
- Barometer - Might affect the mood?
- Wind Speed - Less crime in windy days
- Weather Description - Clear/Foggy/Overcast/etc..
- Day of Week - (Mon - Sun) More crimes on weekends?
- Month of the Year - Some crimes are seasonal (pick-pocketing in NYC during Christmas and such)
- Total Riders - Bus/Subway/etc. More people = more crime
- Unemployment Rate - Some resort to crimes
Model
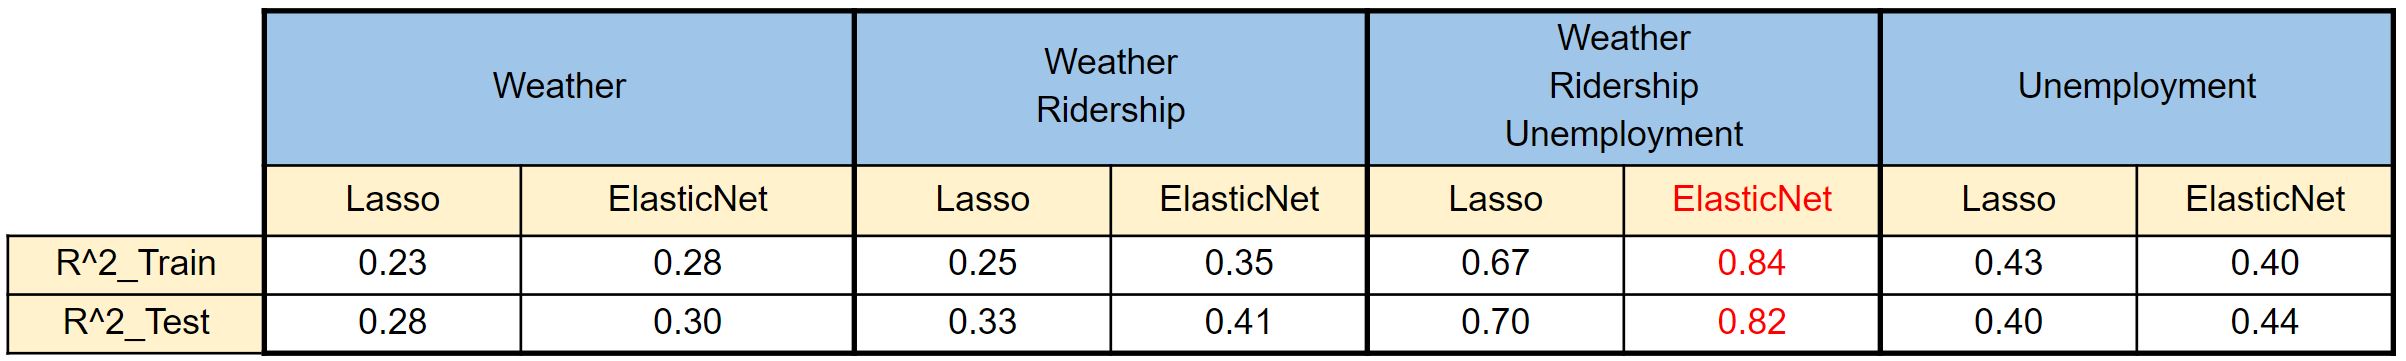
Lasso model was used as a baseline model with only weather data (all numerical features). As more features were added (day of the week, month of the year, weather description, and etc.), I assumed complex interactions among features since predicting a crime rate is a very complex task such as predicting stock price. Therefore, I moved onto ElasticNet model after applying 2nd degree polynomial features to existing features, which resulted in 595 features. ElasticNet was a perfect model for this case since RandomizedSearchCV was utilized on training dataset, this was very important as it applied automatic selection of hyper-parameter and feature selection on top of performing cross validation on the training data.
Below is R^2 score of various combination of models and features.
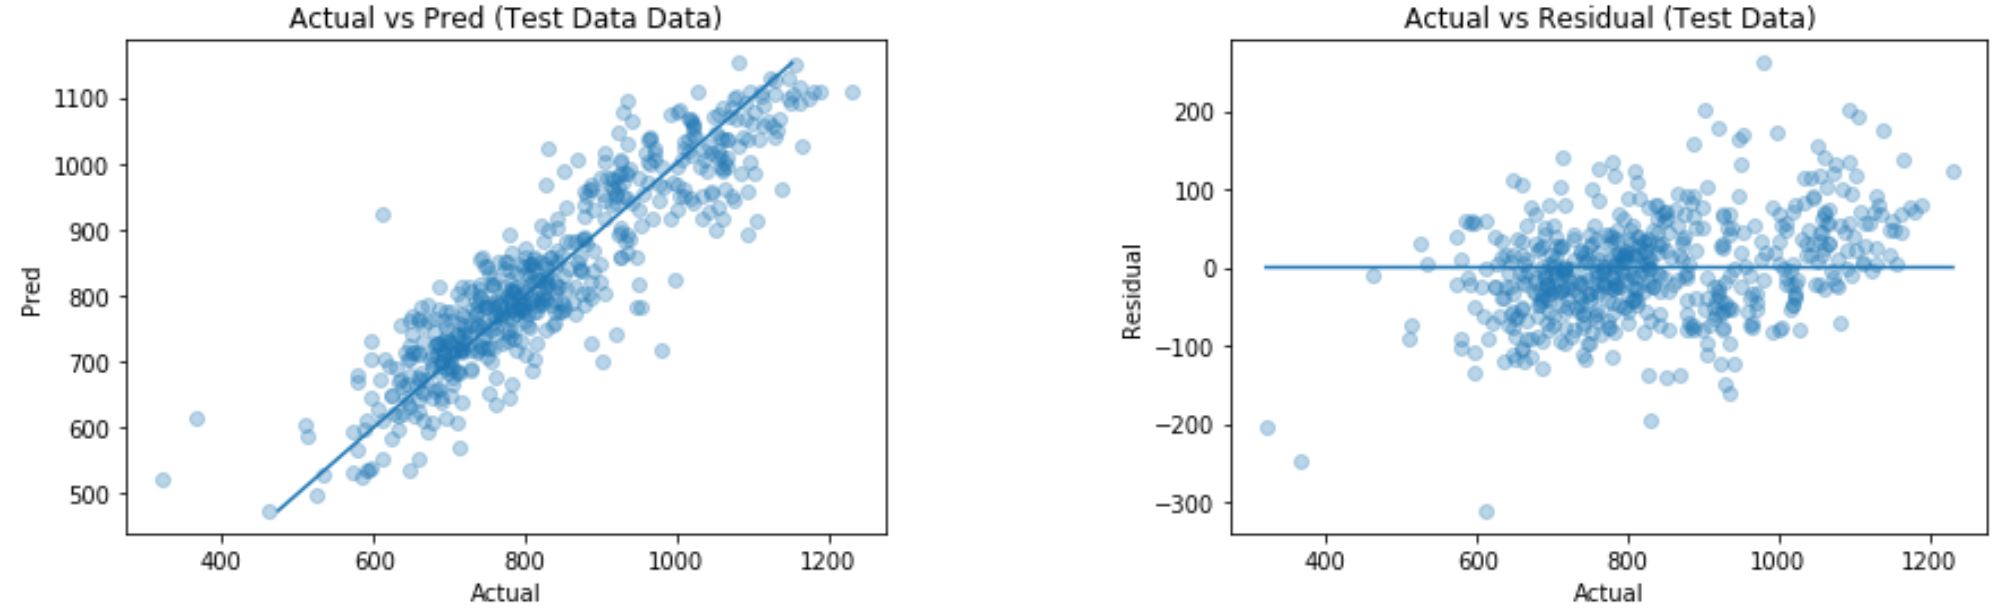
Result
Below is actual vs predicted and residual plot of ElasticNet model that had the best performance. Its MAE (Mean Absolute Error) score was 50, which means my model is able to predict Chicago’s crime rate with +- 50 crimes per day. Coefficients from ElasticNet picked up temperature, total ridership, and unemployment as the most important features that affect crime rate.
Conclusion
This project was all about identifying the right dataset to take advantage of highly explainable linear regression models. Even though my model was able to perform very well with R^2 score of 0.82 on the test set, further investigation is needed to validate the process and measures taken in this project. For future expansion, I would like to add more data such as average income, population density, and etc.